


 are now on the hook for $38,976,827,976,841.63 as of 3/19/26")
By Vijay Sumon
U.S. equities returned 16%* in 2025, fueled by the AI boom, resilient consumer spending and three straight rate cuts toward the end of the year. As markets move through 2026, investor attention remains fixed on shifting geopolitical tensions – from Venezuela to Greenland to Iran – and the upcoming transition of the Federal Reserve (Fed) Chair from Powell to Warsh this May.
Also in focus are uncertainties surrounding trade policy, the U.S. labor market, inflation and the U.S. mid-terms, all of which serve as potential catalysts for market volatility.
How Does Geopolitical Volatility Impact Market Volatility?
Any shifts in geopolitical flashpoints can affect market sentiment and lead to repositioning as investors respond tactically. This dynamic was evident in January, when short-dated at-the-money (ATM) implied volatility in E-mini S&P 500 (ES) options – as represented on a rolling seven-day basis – rose from 9.75% to 11.31% (+1.57%) in response to U.S. action in Venezuela. Similarly, that same volatility metric spiked from 10.49% to 16.50% (+6.01%) following U.S.-EU trade tensions over Greenland.
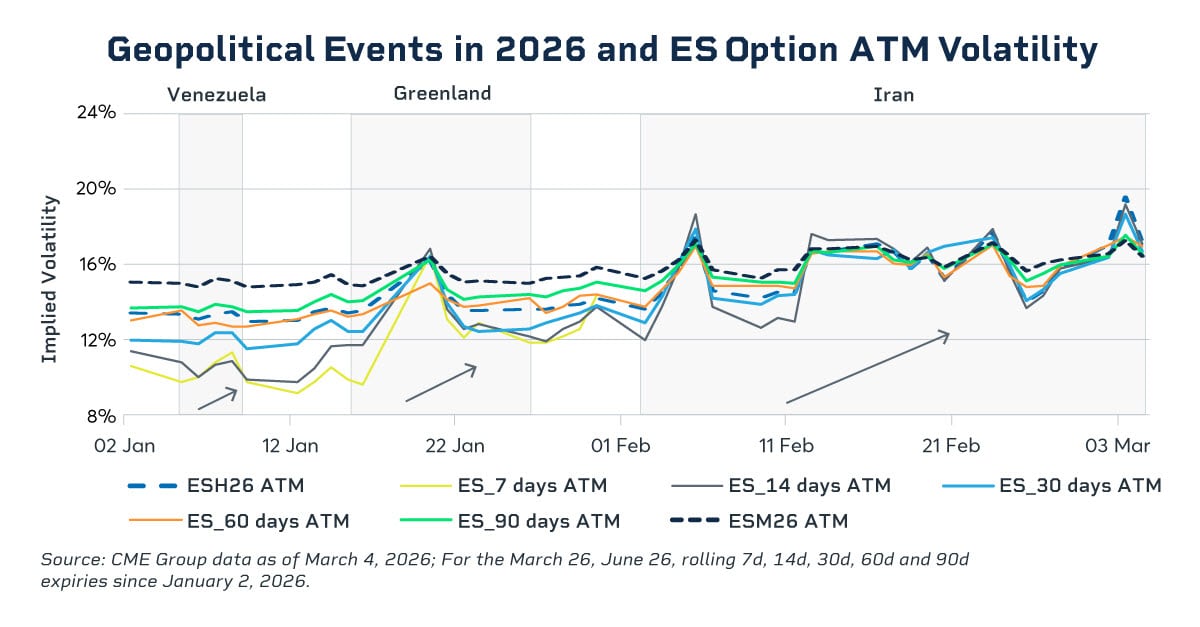
While some investors responded by hedging portfolios via a pronounced shift to defensive strategies, others sought opportunity in navigating a new geopolitical environment.
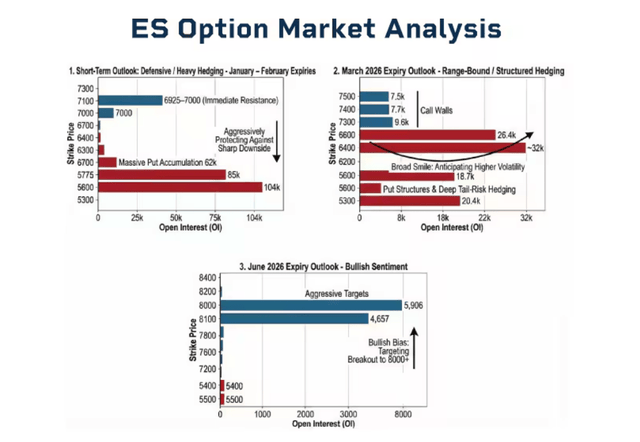
A look at how investors positioned themselves in January using equity index options – as represented by the short-dated January and February, followed by March and June 2026 expiries – reveals a distinct evolution in sentiment.
While the market began January with a “protection” mindset across all maturities, by January 30 positioning had shifted. Immediate risks were largely ignored in favor of aggressive upside speculative targets.
Short-term positioning was heavily defensive, characterized by significant hedging (put options) at lower levels. However, as the timeline extended into the March and June quarterly expiries, sentiment shifted significantly toward a bullish outlook, with traders positioning for upside targets above 8000.
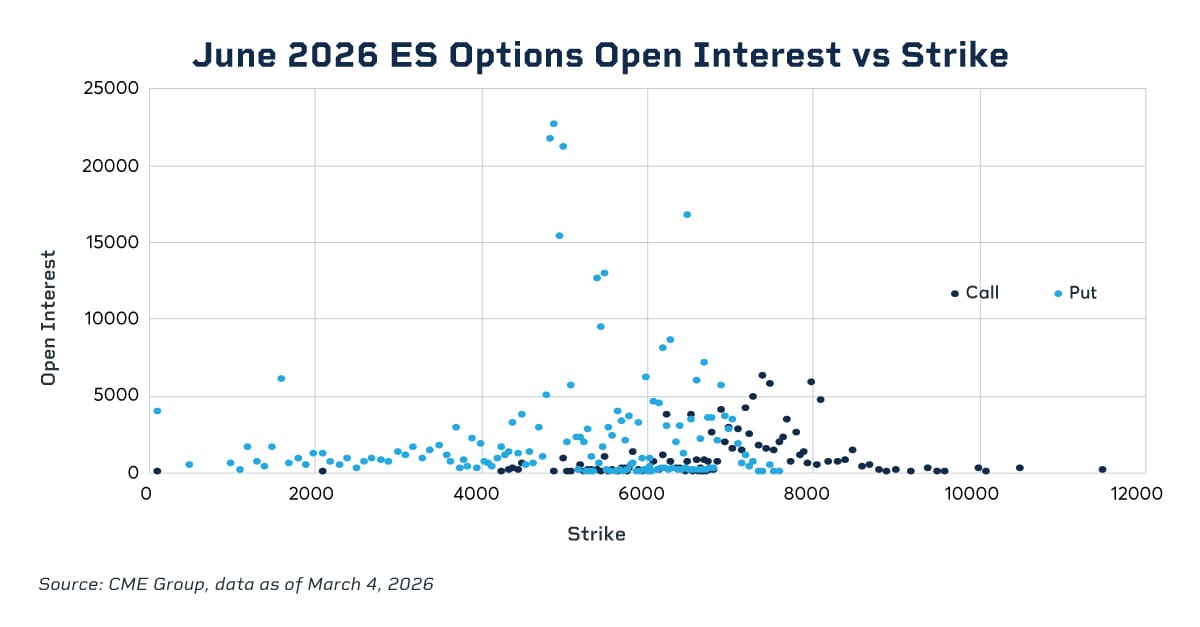
June 2026 Investor Positioning Reveals Lingering Concerns
As of March 4, the market positioning for the June maturity indicates that some traders are preparing for potential volatility by establishing deep out-of-the-money (OTM) hedges at the 4850 and 5000 level, indicating increased institutional demand for downside protection following the geopolitical developments this year. Conversely, bullish speculators are targeting a move toward the 7400–8100 range.
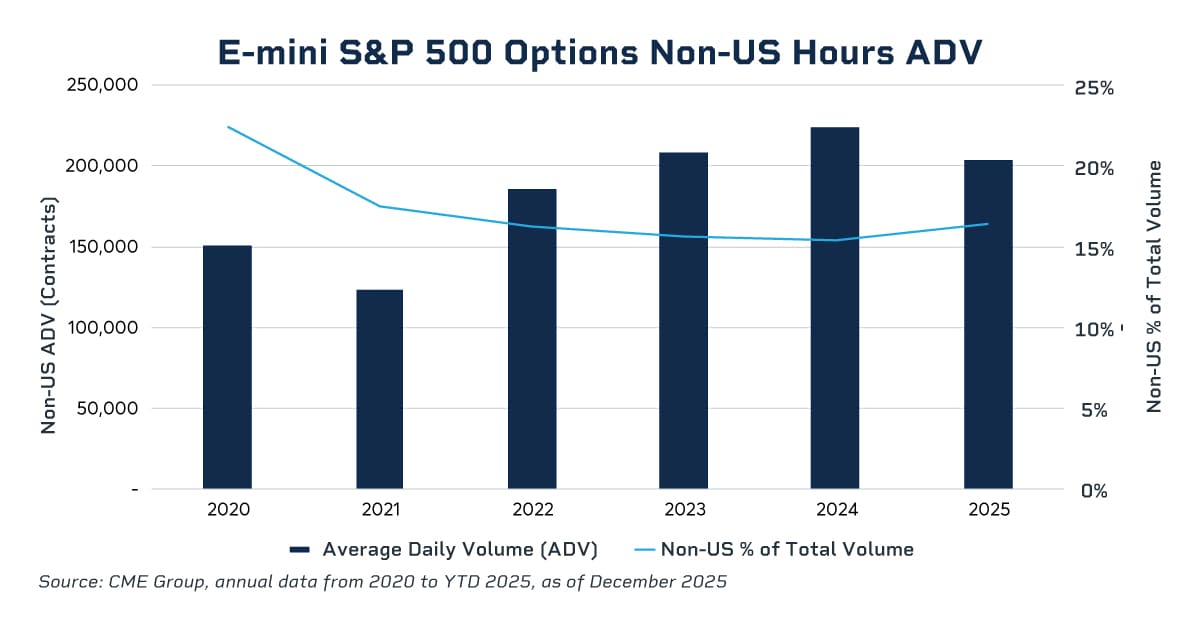
Given the density of events that have occurred only a few weeks into 2026, the ability to adjust exposures in real time – during U.S. and non-U.S. trading hours – remains critical for investors.
The average daily volume for equity index options outside of U.S. trading hours reached over 200,000 contracts as of December 2025, accounting for 16% of the total daily equity options volume, as global institutions increasingly manage their risk around the clock.
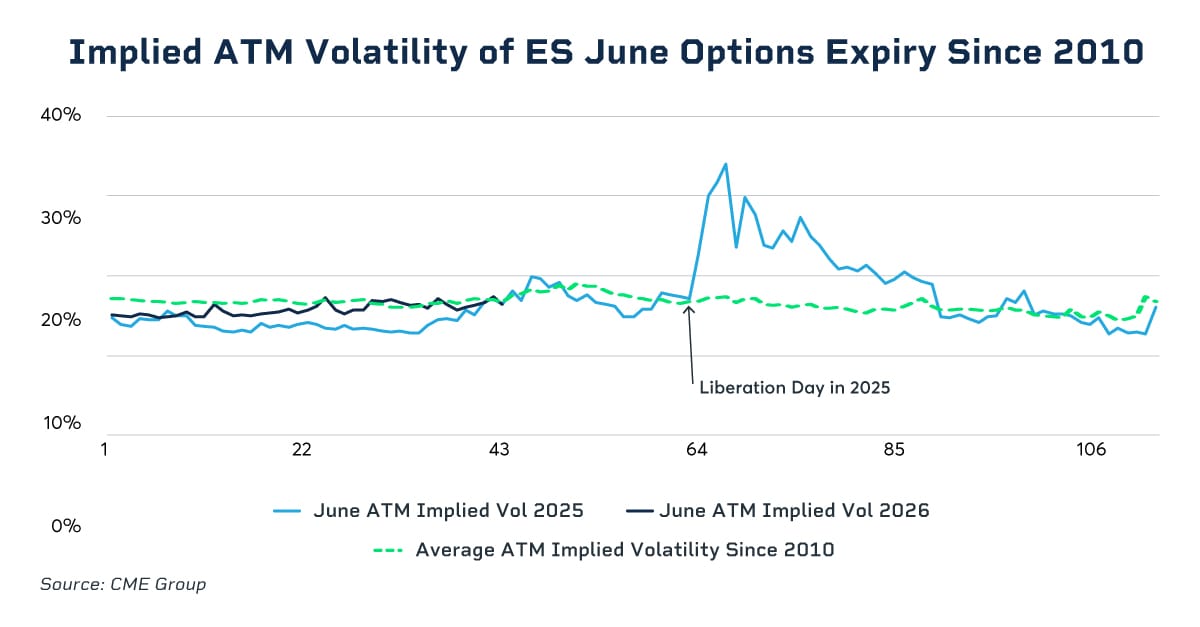
How Do Volatility Levels Compare to Last Year?
As 2026 pans out, June ATM implied volatility is again below its long-term average and trading in-line with levels similar to that of 2025. Trade policy and geopolitical uncertainty in the first half of 2025 caused options premiums and ATM implied volatility to rise. Between March and April 2025, when tariffs were announced on Liberation Day (April 2, 2025), June 25 ATM implied volatility peaked at around 34%.
As market conditions stabilized, implied volatility then moved lower to around 15%, below its long-term average range of 16%-19%. Current 2026 levels appear to be following a similar stabilization pattern for now.
Even so, this year is shaping up to be a period of potential heightened volatility, driven by a complex interplay of economic and geopolitical factors. Options on equity index futures offer a versatile toolkit to navigate this environment.
Whether hedging risk, generating income or positioning for volatility shifts, these instruments provide investors with the flexibility to adapt their strategies as market conditions evolve.
*as measured using the S&P 500 Index
Original Post
Read the full article here
")
")
")
")
